
Who Really Needs Who More - Canada or the United States?
The latest Canada-United States trade dispute has produced no shortage of political claims about which country holds the stronger hand.
But there is a simpler way to examine the relationship.
Forget the slogans for a moment and follow the money.
In 2025, U.S. goods and services trade with Canada totalled an estimated US$872.3 billion according to the Office of the United States Trade Representative.
Around US$425.9 billion flowed from the United States to Canada, combining US$333.6 billion in goods and US$92.3 billion in services.
Approximately US$446.4 billion flowed from Canada into the United States, consisting of US$381.9 billion in goods and US$64.5 billion in services.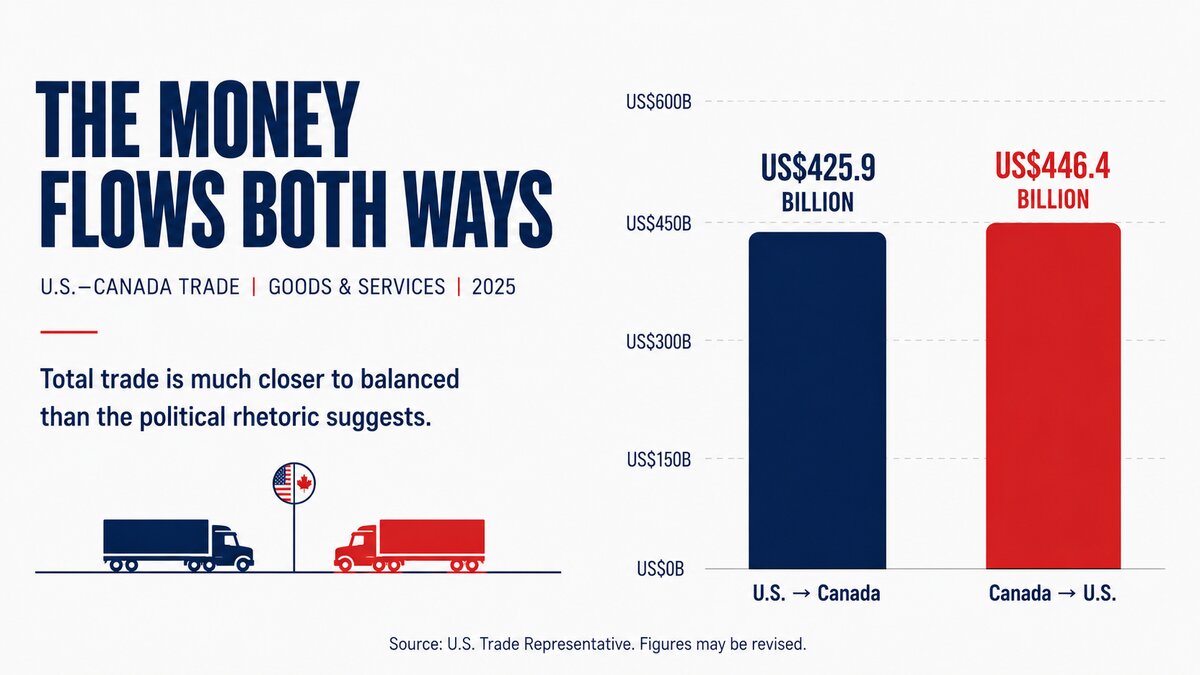
U.S.-Canada goods and services trade flows, 2025. Source: U.S. Trade Representative.
That looks remarkably close to balanced when goods and services are considered together.
But total trade does not tell us which economy is more dependent on the other.
That is where the picture changes dramatically.
Canada is far more dependent on the U.S. market
Statistics Canada reports that 71.7% of Canadian merchandise exports went to the United States in 2025.
The figure fell from 75.9% in 2024, as Canadian exports to the United States declined 5.8% during 2025.
On the American side, U.S. Census data show the United States exported approximately US$2.18 trillion of goods worldwide in 2025, of which US$333.6 billion went to Canada.
That puts Canada's share at roughly 15.3% of total U.S. goods exports.
The asymmetry is difficult to ignore.
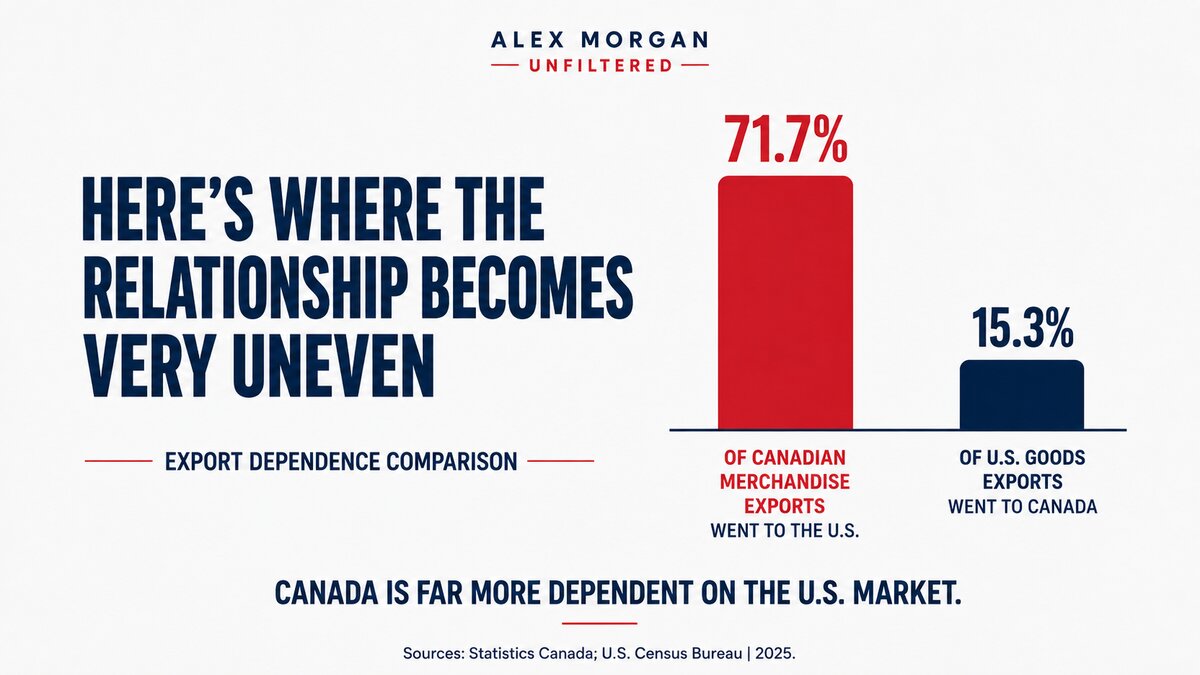
Export dependence is highly uneven. Sources: Statistics Canada; U.S. Census Bureau.
For Canada, losing substantial access to the American market would mean replacing a customer that currently absorbs more than seven out of every ten merchandise export dollars.
For the United States, losing Canada would also hurt - Canada remains an enormous customer - but the American export base is substantially more diversified.
That is the central reason Washington possesses greater economic leverage in a bilateral confrontation.
But Canada is still an extremely important American customer
Greater Canadian dependence should not be confused with American independence from Canada.
U.S. companies sold US$333.6 billion in goods to Canada during 2025.
In the latest detailed U.S. product breakdown currently available for 2024, the largest American exports to Canada included:
| U.S. exports to Canada | 2024 value |
|---|---|
| Vehicles | US$56.6B |
| Machinery | US$53.2B |
| Electrical machinery | US$29.6B |
| Mineral fuels and oils | US$28.1B |
| Plastics | US$15.4B |
Vehicles and machinery alone accounted for almost US$110 billion.
This means Canadian demand matters to American vehicle manufacturers, machinery companies, agricultural producers and thousands of other businesses.
Canadian government material published during the recent trade dispute has also described Canada as the largest export destination for dozens of U.S. states. Those state-level counts can vary depending on year and methodology, so they should not be treated as a single immutable 2025 number.
What does Canada sell America?
The relationship looks different in the opposite direction.
Canada exports energy, motor vehicles, metals, consumer goods, forestry products and a range of industrial inputs into the United States.
The latest detailed Statistics Canada domestic-export breakdown is for 2024.
Among Canadian domestic exports to the United States that year:
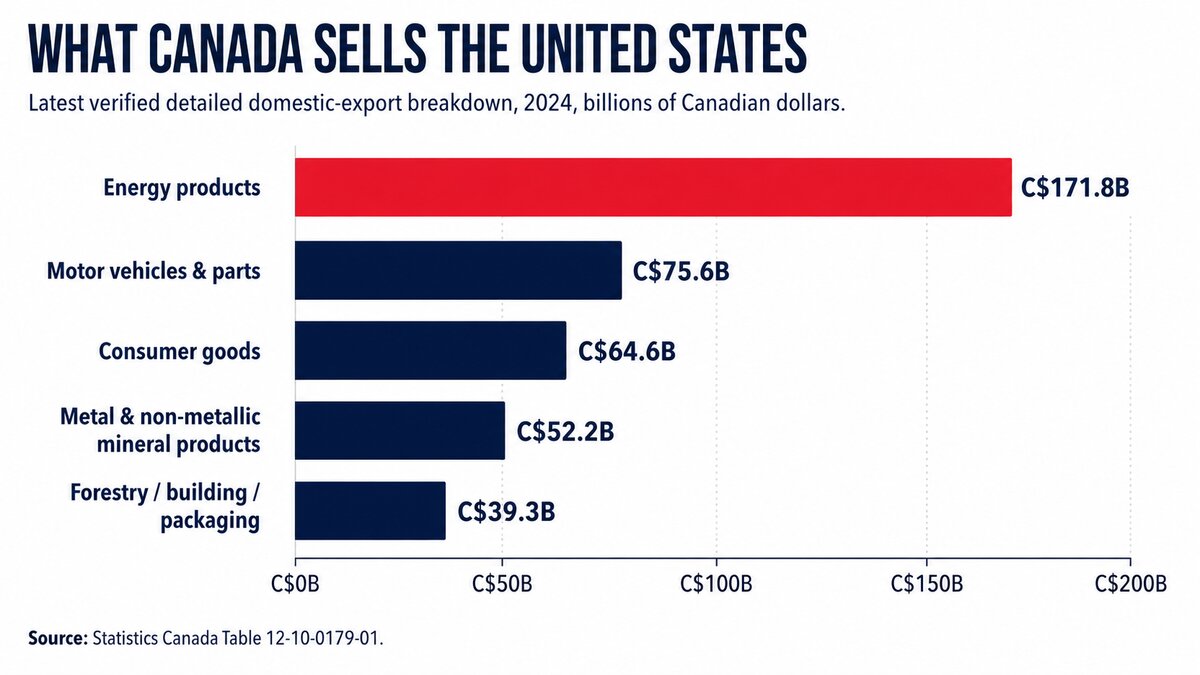
Canadian domestic exports to the United States, 2024. Source: Statistics Canada Table 12-10-0179-01.
Energy was comfortably the largest category.
That concentration in energy helps explain why headline goods-trade balances often make the relationship look much more one-sided than total trade does.
Energy matters - but it is not the entire 2025 story
Using 2024 customs-basis accounting, Canada had a C$124.9 billion goods surplus with the United States.
Energy alone contributed a C$143.7 billion net export surplus.
In fact, Statistics Canada calculated that removing energy from the 2024 calculation would have turned Canada's bilateral goods balance into an C$18.8 billion deficit.
That was a powerful illustration of how important oil, gas and other energy products are to the bilateral merchandise balance.
But that exact calculation should not simply be carried forward into 2025.
The 2025 trade structure changed.
Global Affairs Canada reports Canadian merchandise exports to the United States fell to approximately C$564.6 billion in 2025, while energy exports were among the major areas of weakness.
The more defensible conclusion for 2025 is therefore:
Energy remains a major driver of Canada's goods surplus with the United States - but the 2025 relationship cannot accurately be described as an energy-only story.
The 2025 downturn hit some industries much harder than others
The trade conflict did not affect every Canadian industry equally.
Statistics Canada found that compared with the second quarter of 2024, Canadian exports in the second quarter of 2025 fell:
- 19.5% for energy products
- 16.6% for motor vehicles and parts
- 16.6% for consumer goods
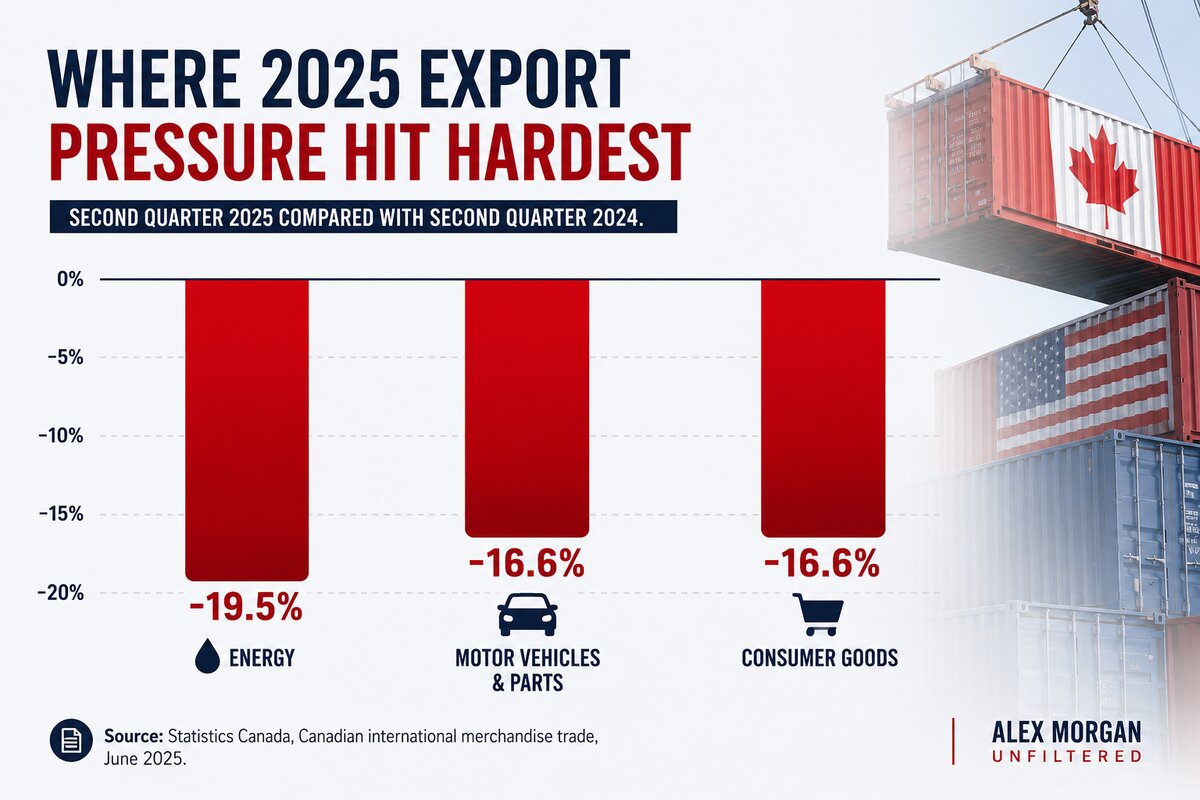
Those sectors were the biggest contributors to the decline in Canadian exports during the quarter.
The figures help explain why tariffs can become politically sensitive very quickly.
The national trade numbers may be enormous, but the economic impact is often concentrated in specific factories, towns and industries.
The border is part of the production line
One of the most important facts in the entire Canada-U.S. relationship is that these are not simply two countries selling finished products to each other.
Their supply chains are intertwined.
Statistics Canada's 2024 Value Added in Exports data found that C$644 billion of exports originating from Canadian production were destined for the United States.
Producing those exports required approximately C$118 billion of imports from the United States.
Canadian manufacturing exports to the United States alone totalled C$324 billion, with more than a quarter of their value reflecting embedded imported U.S. content.
In simple terms:
U.S. parts → Canadian production → U.S. customer.
A component can cross the border before the finished product crosses it again.
This is particularly important in autos, machinery, metals and advanced manufacturing.
A tariff imposed at one stage of that chain can therefore raise costs somewhere else in the same North American production system.
Why the statistics sometimes appear to disagree
Anyone researching Canada-U.S. trade quickly encounters numbers that look contradictory.
For example, one source may say Canada's share of exports to the United States was 71.7%, while another official publication places the customs-basis share around 72%-72.5%.
Likewise, U.S. and Canadian agencies may publish slightly different bilateral totals.
That does not automatically mean one figure is wrong.
International trade can be measured using:
- customs-basis data,
- balance-of-payments data,
- domestic exports versus total exports,
- country of origin,
- country of export,
- goods only,
- or goods and services combined.
Statistics Canada specifically warns that different country-attribution methods can produce different results.
For this analysis, we use same-basis comparisons wherever possible and clearly identify when detailed product data is from 2024 because equivalent 2025 value-added or category data is not yet available.
So who actually needs who more?
The data points to a fairly clear answer.
Canada is more dependent on the United States.
More than 70% of Canadian merchandise exports still go to the U.S. market.
America, by comparison, sends around 15% of its goods exports to Canada.
That gives the United States greater ability to absorb disruption or redirect trade over time.
But that is not the same as saying America has nothing to lose.
The United States sells Canada hundreds of billions of dollars of goods and services.
Canadian demand supports American exporters.
Canadian energy and industrial products feed U.S. production.
And deeply integrated supply chains mean tariffs can increase costs on both sides of the border.
So the most accurate conclusion is not:
“Canada needs America and America does not need Canada.”
Nor is it:
“Both sides are equally dependent.”
The numbers support something more nuanced:
Canada is clearly more dependent on the U.S. market. The United States therefore holds greater economic leverage - but both economies have substantial money, businesses and supply chains exposed to the relationship.
That is why the current dispute matters.
And it is why the real economic story is more complicated than the political rhetoric.
Key numbers at a glance
| Measure | Latest figure |
|---|---|
| 2025 U.S.-Canada goods + services trade | US$872.3B |
| U.S. → Canada goods + services | US$425.9B |
| Canada → U.S. goods + services | US$446.4B |
| Canadian merchandise exports going to U.S. | 71.7% |
| Approx. U.S. goods exports going to Canada | 15.3% |
| Canadian exports to U.S., 2025 change | -5.8% |
| U.S. goods exports to Canada | US$333.6B |
| 2024 U.S. inputs embedded in Canada→U.S. production | C$118B |